When Emojis Meet Data
Aren’t charts supposed to be serious and professional looking? Not always, as I found out.
About a year ago, I signed up to give a presentation on visualising the harmful effects of drugs. I wanted to do something different, to talk about data to a wider group of people who might not always be interested in reading charts.
Lewis, my office mate and friend, suggested I use emojis. I thought he was joking. Who uses emojis in a chart?! But Lewis was serious and I had to agree that emojis are easy to understand and can make abstract data more relatable.
🤔 But how can we use emojis in charts?
Lewis brings the portable whiteboard and begins to draw and explain. The chart will show the average level of physical harm, dependence, and social harm caused by each drug. A different emoji would represent each of type of harm.

I loved it!
It was cute, funny and intuitive. Drug harm data became more accessible, they were not just abstract dots or bars. It was also easy to understand and remember the link between each emoji and type of harm.
⛔ There was only one problem. How do I turn the whiteboard drawing into an actual chart on a computer? Charts usually have dots, bars and lines. I’ve never seen the option to use emojis to create charts on a computer.
I eventually found a way and represented the different harm types with these emojis:
Social harm: 💔 (heart break for others)
Physical harm: 👊 (punch)
Dependence: 🎣 (hooked…)
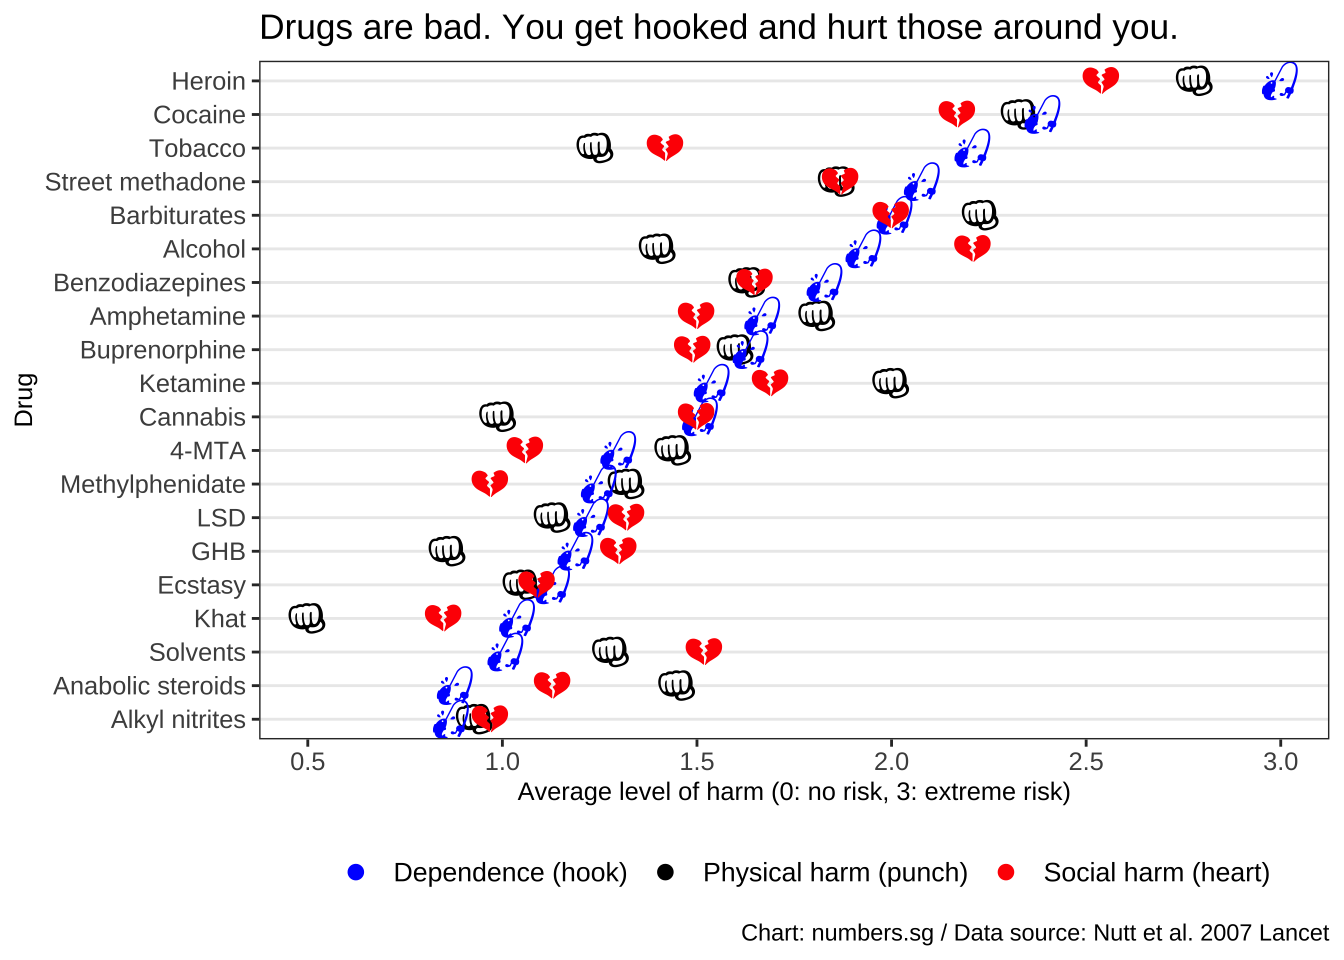
Drugs are bad. They hook you and you end up hurting those around you. Also:
Heroin and Cocaine are really bad 💔 👊 🎣
Alcohol is worse than Cocaine for social harm 💔
Ketamine leads to quite high levels of physical harm 👊
I had expected Cannabis’ dependence score to be lower 🎣
Conclusion
I realised there’s more than one way to make a chart. Stay tuned to see how I did it with code.