3 surprising trends in Singapore's fertility rate
For a country to survive and prosper, its population needs to produce enough children to replace itself. To achieve this, each woman has to give birth to at least 2 (living) children during her childbearing years.
The average number of children per woman is also known as the total fertility rate (TFR). The TFR needed for a population to replace itself is 2.1.1 This means that, on average, each woman must give birth to 2.1 children.2
A TFR of 2.1 is known as the replacement-level fertility. Anything below 2.1 is known as ‘below-replacement fertility’. Anything below 1.3 is known as ‘very low fertility’.
We can use publicly available data3 from the Singapore government to find out:
What is Singapore’s total fertility rate?
Does Chinese new year influence fertility rates? (Hint: maybe)
How different is Singapore’s fertility rate across the different age and ethnic groups?
The chart below shows the total fertility rate (per female) for each year from 1960 to 2016.
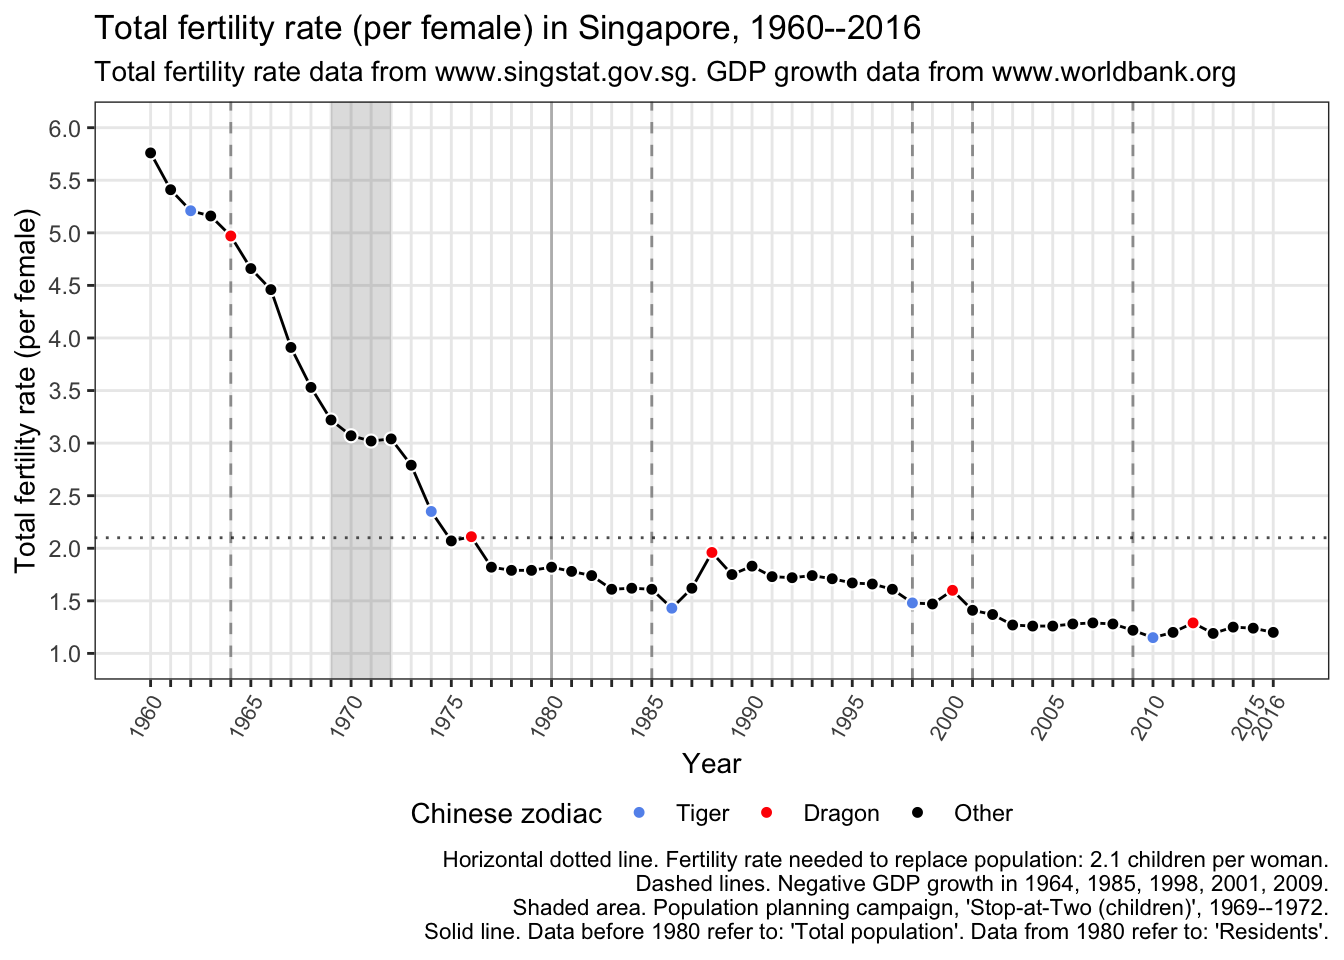
Overall, there is a consistent downward trend in TFR over the years, from 5.76 children per female in 1960, to 1.2 children per female in 2016, which is considered to be ‘very low fertility’.
The TFR dropped below the rate needed to replace the population, which is 2.1 children per female, for the first time in 1975. It increased to 2.11 the next year in 1976. From 1977, the TFR remained below 2.1.
Interestingly, the TFR remained quite constant from 1969 to 1972. These were the years of the government’s population planning campaign to discourage families from having more than two children (click to read more). Three years later, the TFR dropped to around 2 and continued to decrease after.
Chinese new year usually begins in late January or February. This year, the first day of Chinese new year is on 16 February. Each year represented by one of 12 animals and this year is the year of the Dog. We can see some rough trends over the years4.
There is usually a bump in the TFR during the year of the Dragon, but a drop during the year of the Tiger.
On average, from 1960 to 2016, the TFR is highest in the years of the Dragon but lowest in the years of the Tiger among the zodiac signs:
| Chinese zodiac | Average TFR, 1960–2016 (median) |
|---|---|
| Dragon | 1.96 |
| Horse | 1.79 |
| Rooster | 1.76 |
| Snake | 1.75 |
| Dog | 1.73 |
| Goat | 1.73 |
| Monkey | 1.72 |
| Rat | 1.66 |
| Pig | 1.64 |
| Rabbit | 1.62 |
| Ox | 1.61 |
| Tiger | 1.48 |
What about the total fertility rate by the three major ethnic groups in Singapore?
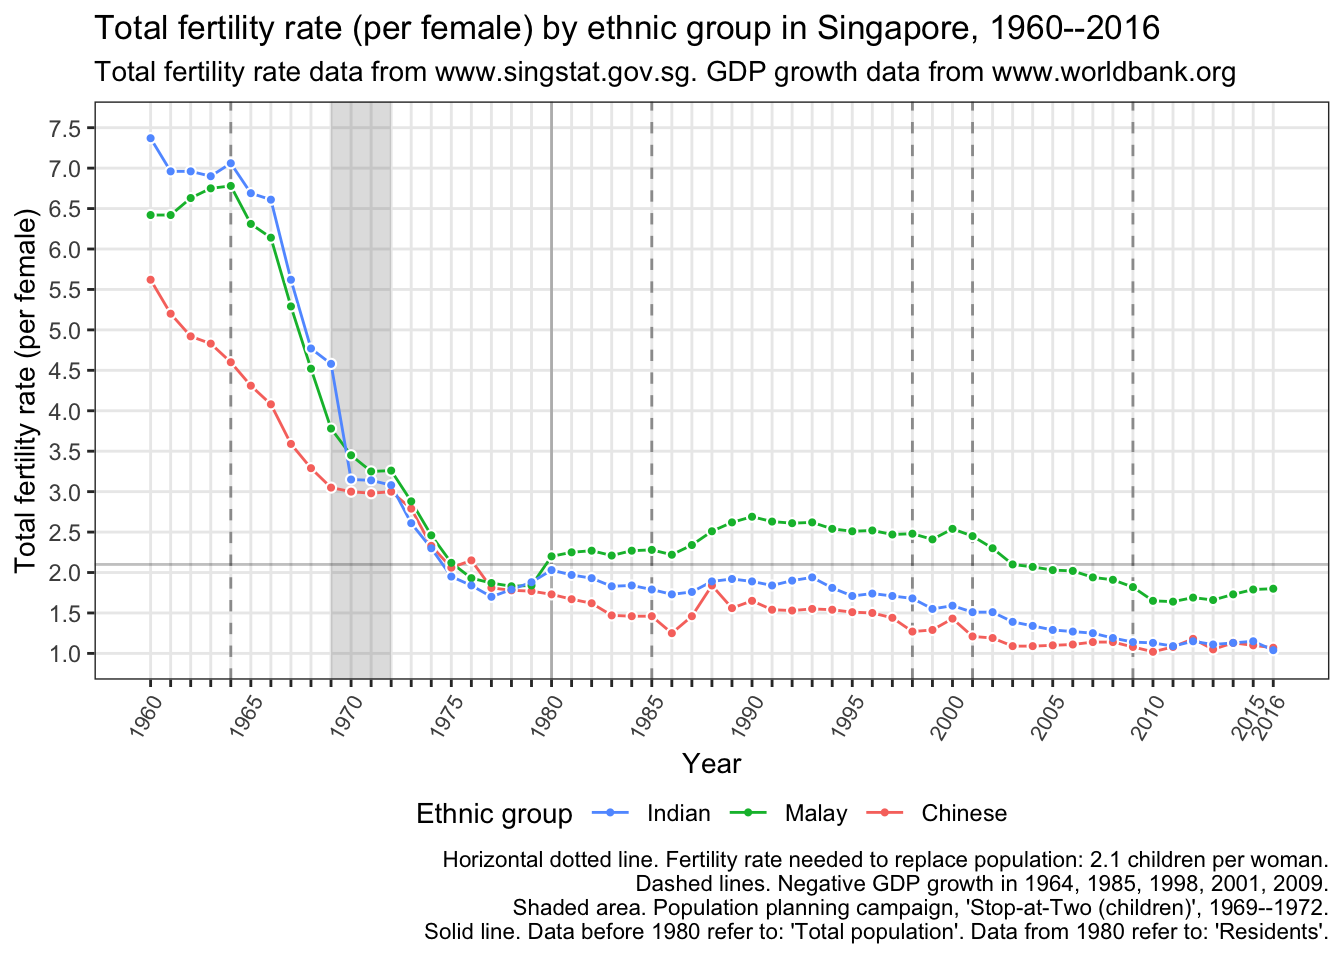
There is an overall downward trend in the TFR across the three major ethnic groups over the years. In 2016, the TFR for all three groups was below 2.1.
In 1960, Indian females had the highest TFR (7.37), followed by Malay females (6.42), and then Chinese females (5.62).
In 2016, Indian females had the lowest TFR (1.04). Malay females had the highest TFR (1.8). Chinese females were in the middle with a TFR of 1.07, which is just slightly higher than the TFR of Indian females.
Interestingly, the TFR for all three ethnic groups was very similar from 1970, which coincided with the government’s population planning campaign, to 1979.
- There was a drastic drop in the TFR for Indian females from 1969 to 1970. This was the biggest year-over-year drop (of -1.43) in the TFR for Indian females.
From 1980, a different trend for each ethnic group’s TFR emerges. For example, the TFR for Malay females started to increase, and remained above the population replacement rate of 2.1 until 2003.
Look again at the trend for Chinese females. Notice the bumps during the Dragon years of 1976, 1988, 2000, 2012? The bumps don’t really appear for the other ethnic groups!
One reason for the declining TFR is: women are conceiving when they are older (click to read more). What trends can the data reveal?
The chart below shows the total fertility rate per 1,000 females (note the change as compared to ‘TFR per female’ in the previous charts) by the different age groups from 1960 to 2016.
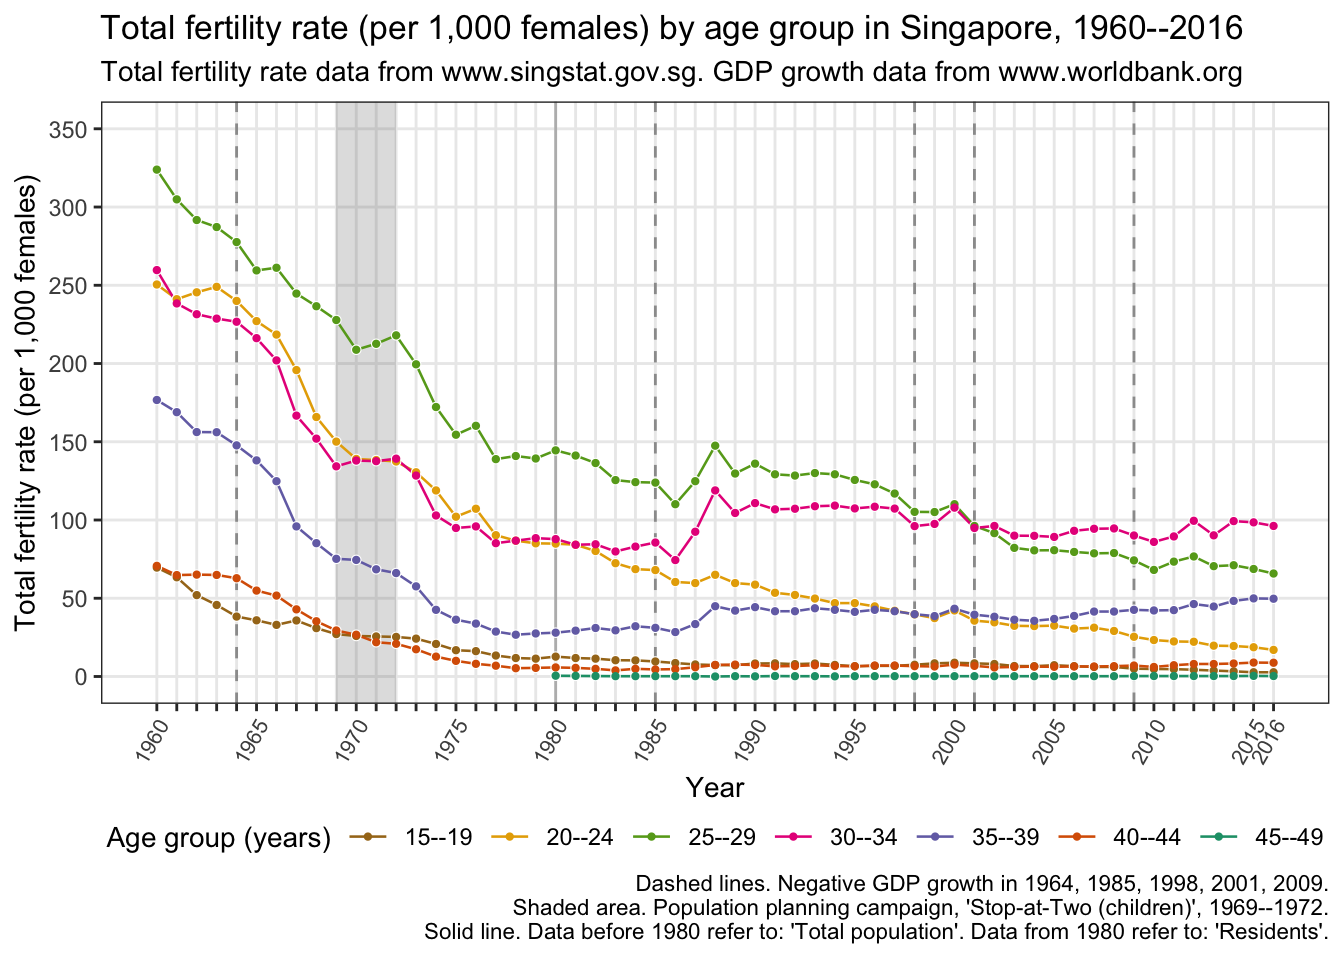
Overall, there was a downward trend in the TFR across all age groups.
In 1960, women who were 20–34 years old (from the three age groups) had the highest TFR.
In 2016, women who were 25–39 years old (from the three age groups) had the highest TFR.
The TFR for women who were 20–24 years old declined drastically.
Up until the early 1980s, the TFR was very similar to the TFR of women who were 30–34 years old (see the yellow and pink lines).
From then, the TFR for women who were 20–24 years old started to decline rapidly while the TFR for women who were 30–34 years old started to increase rather rapidly.
By 2016, the TFR for the 20–24 year-olds was closest to the TFR of the 40–44 year-olds.
Assuming no net migration and unchanged mortality.↩
There is no such thing as 0.1 child. 2.1, represents the average number of children each woman in the entire population needs to give birth to. It may be more intuitive to think of it as at least 2 children.↩
Annual GDP growth (%) data from: https://data.worldbank.org/indicator/NY.GDP.MKTP.KD.ZG?locations=SG↩
The numbers are an approximation and won’t be entirely accurate because of differences in the Chinese and conventional, Gregorian, calendars. For example, when the new year starts.↩